Version 2024 of the international SOCAT ocean CO2 database
The latest version of the international data-base SOCAT (Surface Ocean CO2 Atlas, www.socat.info) has been released on June 18 2024. SOCAT version 2024 assembles more than 47 million of carbon dioxide sea surface observations in the global ocean, marginal seas and coastal zones. The laboratory Laboratoire d’océanographie et du climat : expérimentation et approches numériques (LOCEAN-IPSL/OSU Ecce Terra, SU/CNRS/MNHN/IRD) is involved in this project that was first discussed during an international workshop organized in Paris/UNESCO in 2007.
The ocean plays a crucial role in the regulation of climate change. It absorbs more than 90% of excess heat and presently a quarter of CO2 emitted by human activities (fossil fuels and land-used changed). Since 1750, the ocean captured about 190 PgC (Peta-gramme of Carbon) of a total of 730 PgC anthropogenic emissions (Friedlingstein et al., 2023). Without this ocean carbon sink, the CO2 concentration in the atmosphere would be around 517.2 ppm compared to 422.1 ppm as observed in January 2024.
To quantify the ocean carbon sink each year, it is important to maintain and integrate ocean CO2 observations from year to year in all ocean regions, including marginal seas and coastal zones where the variability of the oceanic biogeochemical properties (including CO2) is pronounced. This is the aim of the SOCAT project started in 2007 during an international workshop organized in Paris/UNESCO (Metzl et al., 2007), a data-base regularly updated since 2011 (Pfeil et al., 2013; Bakker et al., 2016). Since last year, SOCAT added 4 million of new quality controlled fCO2 observations from 336 cruises, VOS lines, moorings or drifting platforms (Figure 1). Notice that there were few observations in the Indian and Southern Ocean in recent years. In the future, observations should be conducted in these regions in order to better evaluate ocean models and offer constraint for neural network approaches (Figure 2).
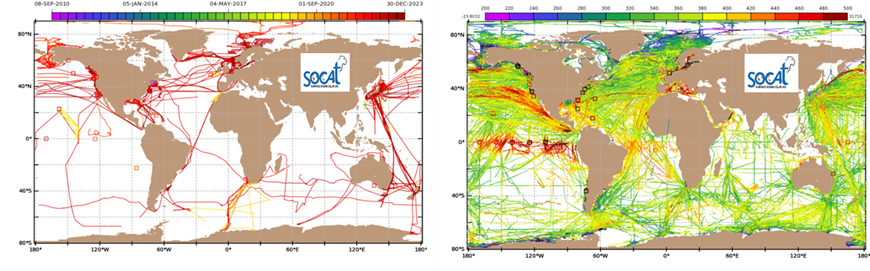
Figure 1. Left: Map of the new sea surface CO2 fugacity (fCO2) added in the SOCAT version 2024 (color code is for year). Right: All fCO2 (µatm) data in SOCAT for the period 1957-2023 (7793 cruises). Squares identified CO2 probes on moorings. The atmospheric CO2 level in the atmosphere being around 420 ppm today, the blue-green region (resp. red) identified ocean CO2 sink (resp. source). Note few observations available in recent years in the Southern and the Indian Oceans that calls to use data-based approaches to extrapolate the fCO2 field, calculate air-sea CO2 fluxes at large scale (Figure 2) or to reconstruct the sea surface pH distribution and evaluate ocean acidification (Figure 3).
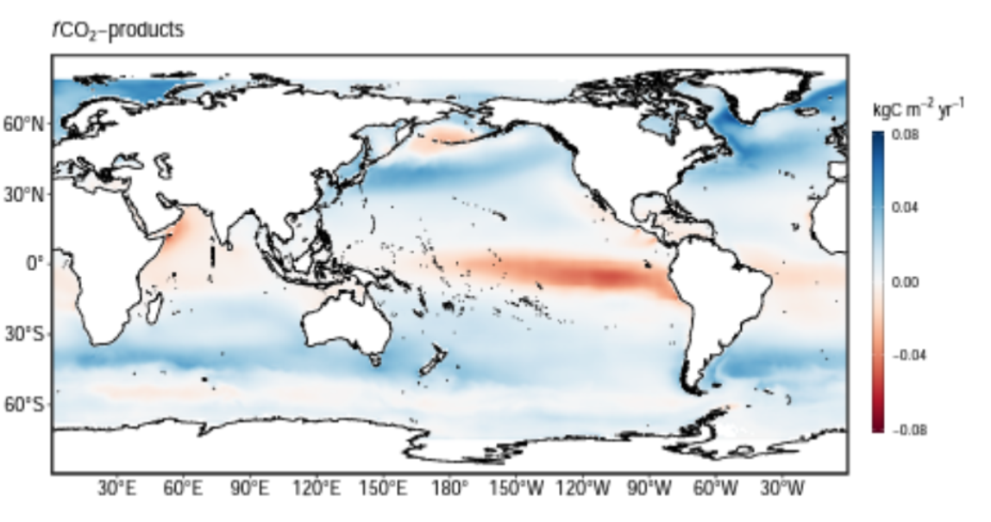
Figure 2. Mean air-sea CO2 fluxes (molC/m2/yr) for the period 2013-2022; the map has been produced using methods based on SOCAT data. The blue regions (resp. red) identify ocean carbon sink (resp. source). Adapted from Friedlingstein et al., (2023).
Since the first SOCAT version published in 2011 with 6.3 million data, SOCAT includes today 47 million sea surface fCO2 data in the global ocean and coastal zones for the period 1957-2023 (Bakker et al. 2024). Each data set available on-line is associated with quality control information (Quality Flag, Lauvset et al., 2019). SOCAT also offers gridded products (monthly scale) that could be used to validate ocean biogeochemical models and coupled climate/carbon models (CMIP6). An interactive tool (LAS Data viewer) enables to visualize the data and download them for specific region or period. The SOCAT data-base is also available in ODV format (Ocean Data View, https://odv.awi.de/).
The new SOCAT version will be used to estimate the 2023 global carbon budget (www.globalcarbonproject.org) that should be published before the next COP-28 in November 2024. A direct impact of anthropogenic CO2 accumulating in the oceans leads to the process called “ocean acidification” (decrease of pH). This is now relatively well observed in all oceans as evaluated from SOCAT data (Figure 3) but understanding of the impacts of ocean acidification on marine organisms (like phytoplankton or corals) needs to be improved.
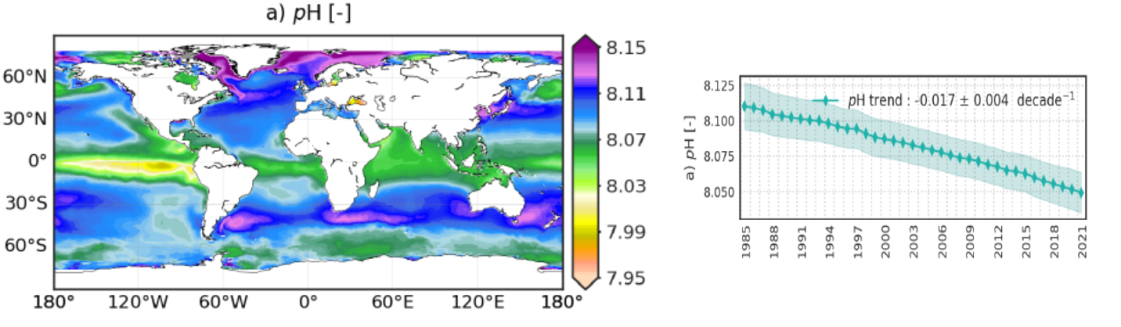
Figure 3. An example of sea surface pH climatology and it temporal change. Results from a neural network model constrained with SOCAT data (model CMEMS-FFNN-LSCE, Chau et al., 2024). The average pH decrease of around -0.017 per decade over 1985-2021 represents the so-called “ocean acidification” mainly due to the anthropogenic CO2 uptake.
The LOCEAN/IPSL laboratory feeds regularly data in SOCAT (from observatories SNO/OISO, PIRATA, SSS-CO2), contributes to the data quality control for the Tropical Atlantic, Indian and Southern Ocean regional SOCAT groups. The project is coordinated by Dorothee Bakker (East Anglia University, Norwich UK). It has been supported by international programs (SOLAS, IMBER, IOCCP), European, USA, Australian, Japan projects, and many national institutions, but the work of providing data and their quality control is mainly carried out by volunteer researchers and, in the future, ensuring the continuity of these efforts will require sustainable means (Bakker et al., 2023; IOCCP, 2024).
Contact
References
Bakker, D. C. E., Pfeil, B., Landa, C. S., Metzl, N., O’Brien, K. M., et al., 2016.: A multi-decade record of high-quality fCO2 data in version 3 of the Surface Ocean CO2 Atlas (SOCAT), Earth Syst. Sci. Data, 8, 383-413, https://doi.org/10.5194/essd-8-383-2016
Bakker, D., R. Sanders, A. Collins, M. DeGrandpre, T. Gkritzalis, S. Ibánhez, S. Jones, S. Lauvset, N. Metzl, K. O’Brien, A. Olsen, U. Schuster, T. Steinhoff, M. Telszewski, B. Tilbrook, D. Wallace, 2023. Case for SOCAT as an integral part of the value chain advising UNFCCC on ocean CO2 uptake http://www.ioccp.org/images/Gnews/2023_A_Case_for_SOCAT.pdf
Bakker, D. C. E., et al., 2024. SOCAT version 2024 released. Poster available online www.socat.info
Chau, T.-T.-T., Gehlen, M., Metzl, N., and Chevallier, F.: CMEMS-LSCE: a global, 0.25°, monthly reconstruction of the surface ocean carbonate system, Earth Syst. Sci. Data, 16, 121–160, https://doi.org/10.5194/essd-16-121-2024, 2024.
Friedlingstein, P., et al.: Global Carbon Budget 2023, Earth Syst. Sci. Data, 15, 5301–5369, https://doi.org/10.5194/essd-15-5301-2023, 2023.
IOCCP, 2024. Declaration on Operationalising the Surface Ocean Carbon Value Chain. http://www.ioccp.org/images/Gnews/Declaration_on_Operationalising_the_Surface_Ocean_Carbon_Value_Chain.pdf
Lauvset S., K. Currie, N. Metzl, S. Nakaoka, D. Bakker, K. Sullivan, A. Sutton, K. O’Brien and A. Olsen, 2019. SOCAT Quality Control Cookbook For SOCAT version 7. Int. Report. www.socat.info.
Metzl, N., Tilbrook, B., Bakker, D. C. E., Le Quéré, C., Doney, S., Feely, R., Hood, M., Dargaville, R., 2007. Global Changes in Ocean Carbon: Variability and Vulnerability. Eos, Transactions of the American Geophysical Union 88 (28): 286-287. https://doi:10.1029/2007EO280005
Pfeil, B., Olsen, A., Bakker, D. C. E., et al., 2013. A uniform, quality controlled Surface Ocean CO2 Atlas (SOCAT), Earth Syst. Sci. Data, 5, 125-143, https://doi:10.5194/essd-5-125-2013