40 Millions observations in version 2022 of the international SOCAT ocean CO2 database
The latest version of the international data-base SOCAT (Surface Ocean CO2 atlas, www.socat.info) has been released on June 14th 2022. SOCAT version 2022 assembled 40 Millions of carbon dioxide sea surface observations in the global ocean, marginal seas and coastal zones. The laboratory Laboratoire d’océanographie et du climat : expérimentation et approches numériques (LOCEAN-IPSL/OSU Ecce Terra, SU/CNRS/MNHN/IRD) is involved in this project that was first discussed during an international workshop organized in Paris/UNESCO in 2007.
The ocean plays a crucial role to regulate the climate change. It absorbs more than 90% of heat excess and presently a quarter of CO2 emitted by human activities (fossil fuels and land-used changed). Since 1750, the ocean captured about 180 PgC (Peta-gramme of Carbon) of a total of 690 PgC anthropogenic emissions (Friedlingstein et al., 2022). Without this ocean carbon sink, the CO2 concentrations in the atmosphere would around 500 ppm compared to 417.3 ppm as observed in January 2022. As recall last year, although the CO2 emissions decreased slightly due to the pandemic COVID-19, the atmospheric CO2 continues to rise, +2.4 ppm in 2020 and +2.7 ppm en 2021.
In the context of a changing climate from decade to decade, it is important to evaluate each year the global carbon budget for a better understanding of its recent evolution, the processes that control carbon exchanges between the reservoirs, reducing the uncertainties in the climate predictions and guiding the political decisions and adaptations at international level. For this, researchers compile the inventories of anthropogenic emissions and the atmospheric and oceanic observations needed to evaluate the air-sea CO2 exchange. The terrestrial carbon sink is evaluated from models or derived from the residual of the carbon budget between other compartments (Friedlingstein et al. 2022).
A direct impact of anthropogenic CO2 accumulated in the oceans leads to the process called “ocean acidification” (decrease of pH). This is now relatively well observed in all oceans as evaluated from SOCAT data (Jiang et al 2019) but the impacts of ocean acidification on marine organisms (like phytoplankton or corals) need to be improved. Consequently, and like the temperature, the sea-level or ice melt and retreat, ocean pH is now recognized as one of the 7 “ocean indicators” for global change issue (Global Climate Indicator, WMO/GCOS, 2018) and this is now included in the WMO Climate report (State of Global Climate 2021, WMO, 18 May 2022).
To quantify the ocean carbon sink each year, it is important to maintain and integrate ocean CO2 observations from year to year in all ocean regions, including marginal seas and coastal zones where the variability of the oceanic biogeochemical properties (including CO2) is pronounced. This is the aim of the SOCAT project started in 2007 during an international workshop organized in Paris/UNESCO (Metzl et al., 2007), a data-base regularly updated since 2011(Pfeil et al., 2013; Bakker et al., 2016).
Since last year, SOCAT added 7 Millions of new quality controlled fCO2 observations from 420 cruises, VOS lines, moorings or drifting platforms (Figure 1). Interestingly, since 2 years, CO2 observations were also conducted on-board sail-ships during ocean racings, and will be recorded during the races « Vendée-Arctique » (started last 12th June) and « La Route du Rhum » in autumn. We also note the recent data collected from autonomous Sail-Drone platforms (Sutton et al., 2021).
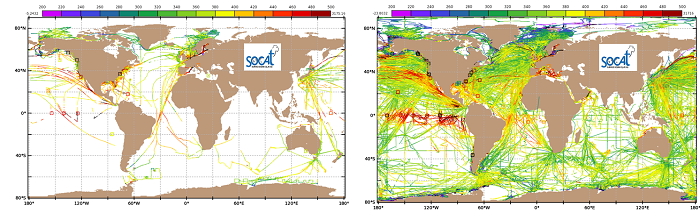
Figure 1. Left: Map of the new sea surface CO2 fugacity (fCO2, µatm) added in the SOCAT version 2022 (mainly for the period 2020-2021). Right: All data in SOCAT for the period 1957-2021. Squares identified CO2 probes on moorings. The atmospheric CO2 level in the atmosphere being around 415 ppm in 2021, the blue-green region (resp. red) identified ocean CO2 sink (resp. source). Note few observations available in recent years in the south Pacific and Indian Oceans that calls to use data-based approaches to extrapolate the fCO2 field and calculate integrated air-sea CO2 fluxes at large scale (Figure 2) to estimate the ocean carbon sink over several decades (Figure 3).
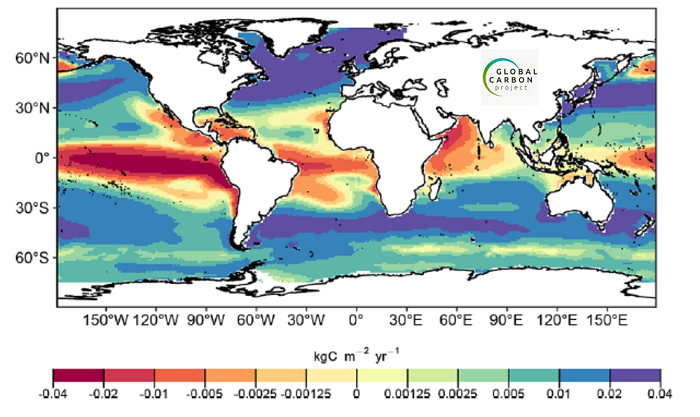
Figure 2. Mean annual air-sea CO2 fluxes (kgC/m2/yr) for the decade 2011-2020 from ocean models or diagnostics methods based on SOCAT data. The tropics act as CO2 source for the atmosphere (in red), whereas temperate and polar zones act as CO2 sink (blue). Source: Global Carbon Project (Friedlingstein et al., 2022).
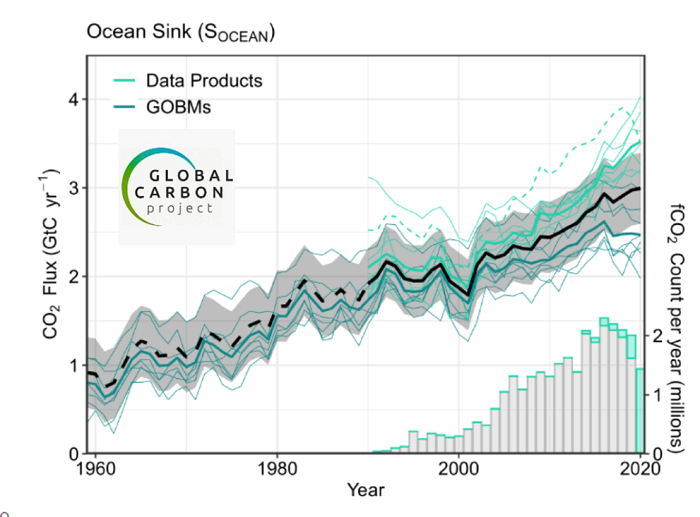
Figure 3. The global ocean carbon sink for the period 1959-2020 using ocean models (individual in green, model mean in black and uncertainty is gry) or from data-based approaches using SOCAT (en cyan). Source: Global Carbon Project (Friedlingstein et al, 2022). The bars (bottom right) inform on the number of fCO2 data available each year in SOCAT to constraint the diagnostic methods. Both models and diagnostic methods show an increase of the ocean carbon sink. Notice that observations suggest larger interannual variability not yet resolved in the models.
Since the first SOCAT version published in 2011 with 6.3 million data, SOCAT includes today 40 million sea surface fCO2 data in the global ocean and coastal zones for the period 1957-2021 (Bakker et al. 2022). Each data available on-line is associated with a quality control information (Quality Flag, Lauvset et al., 2019). SOCAT also offers gridded products (monthly scale) that could be used to validate ocean biogeochemical models. An interactive tool (LAS Data viewer) enables to visualize the data and download them for specific region or period. The SOCAT data-base is also available in ODV format (Ocean Data View, https://odv.awi.de/).
The annual SOCAT public release contributes to UN Sustainable Development Goals (SDG) 13 and 14 (#OceanAction20464) and to the UN Decade of Ocean Science for Sustainable Development. SOCAT has been used in more than 400 publications and international reports (www.socat.info/publications.html), in particular:
- SOCAT is referenced in the IPCC reports (Canadell et al., 2021)
- SOCAT informs the Global Carbon Budget (Figures 2 & 3, Friedlingstein et al., 2022, www.globalcarbonproject.org) and annual climate reports (Blunden, and Boyer, 2021)
- SOCAT is used to quantify and understand the seasonal to decadal variability of the ocean carbon sink in the open ocean, coastal seas or marginal seas such as the Mediterranean sea (e.g. Rödenbeck et al. 2015; Laruelle et al., 2018; Coppola et al., 2021; Chau et al., 2022; Metzl et al., 2022 ; DeVries, 2022)
- SOCAT is used to evaluate the ocean acidification (Figure 4; e.g., Jiang et al., 2019; Iida et al., 2020; Lo Monaco et al., 2021; Leseurre et al., 2022)
- SOCAT is used to evaluate sensor data from Bio-ARGO floats (e.g. Bushinsky et al., 2019).
- With the GLODAP database (glodap.info) for the ocean interior, SOCAT offers important complement for the knowledge of anthropogenic CO2 inventories in the oceans (Watson et al.2020; Tanhua et al., 2021; Crisp et al. 2022).
- SOCAT help for the design of new international projects (Wanninkhof et al., 2019; projet SOCONET, aoml.noaa.gov/ocd/gcc/SOCONET/)
- SOCAT data are part of the GOA-ON database (Global Ocean Acidification Observing Network, goa-on.org)
- SOCAT is now integrated in the European DTO plateform (Digital Twin of the Ocean):
https://www.eu4oceanobs.eu/towards-european-digital-ocean/; https://blue-cloud.org/data-infrastructures/socat
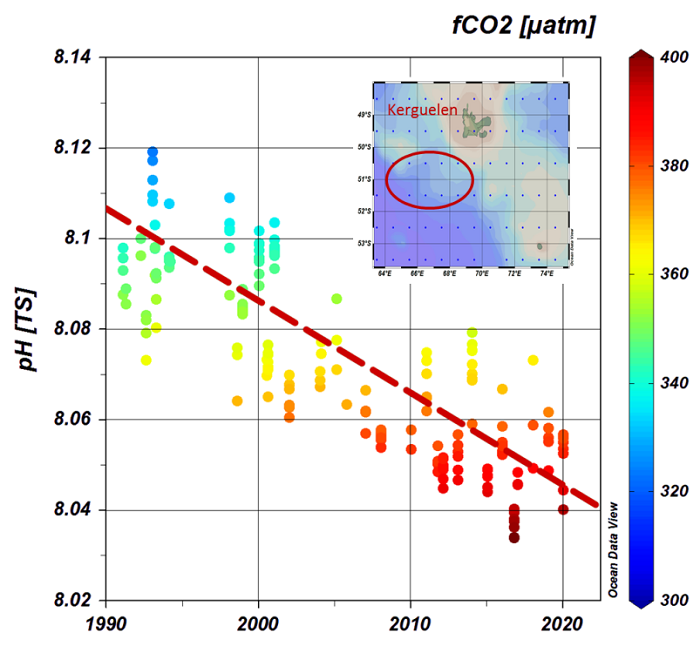
Figure 4. An example of the pH trend evaluated from fCO2 data in SOCAT (monthly product). Here, we have select the data near the French Kerguelen Islands in the Southern Indian Ocean (insert map). Over 1990-2020 we estimate a pH decrease of around -0.002 unit per year (red line). This pH decrease is directly associated to the fCO2 increase in surface waters (in µatm, color code from blue to red) linked to the progressive accumulation of anthropogenic CO2 in the ocean.
The LOCEAN/IPSL laboratory feeds regularly data in SOCAT (from observatories SO/OISO, PIRATA, SSS, Boussole/Dyfamed), contributes to the data quality control for the Tropical Atlantic, Indian and Southern Ocean regional SOCAT groups. The project is coordinated by Dorothee Bakker (East Anglia University, Norwich UK). It is supported by international programs (SOLAS, IMBER, IOCCP, ICOS), European projects and many national institutions, but the work of providing data and their quality control is mainly carried out by volunteer researchers and, in the future, ensuring the continuity of these efforts will require sustainable means.
Contact
Nicolas Metzl, LOCEAN-IPSL • +33 1 44 27 33 94 – +33 6 77 47 72 48 –
| References
Bakker, D. C. E., Pfeil, B., Landa, C. S., Metzl, N., O’Brien, K. M., et al., 2016.: A multi-decade record of high-quality fCO2 data in version 3 of the Surface Ocean CO2 Atlas (SOCAT), Earth Syst. Sci. Data, 8, 383-413, doi:10.5194/essd-8-383-2016 Bakker, D., et al., 2022. SOCAT version 2022 for quantification of ocean CO2 uptake. Poster available online www.socat.info Blunden, J. and T. Boyer, Eds., 2021: “State of the Climate in 2020”. Bull. Amer. Meteor. Soc., 102 (8), Si–S475, https://doi.org/10.1175/2021BAMSStateoftheClimate.1 Bushinsky, S. M., Landschützer, P., Rödenbeck, C., Gray, A. R., Baker, D., et al., 2019. Reassessing Southern Ocean air-sea CO2 flux estimates with the addition of biogeochemical float observations. Global Biogeochemical Cycles, 33. doi: 10.1029/2019GB006176 Canadell, J. G., P. M. S. Monteiro, M. H. Costa, L. Cotrim da Cunha, P. M. Cox, A. V. Eliseev, S. Henson, M. Ishii, S. Jaccard, C. Koven, A. Lohila, P. K. Patra, S. Piao, J. Rogelj, S. Syampungani, S. Zaehle, K.Zickfeld, 2021, Global Carbon and other Biogeochemical Cycles and Feedbacks Supplementary Material. In: Climate Change 2021: The Physical Science Basis. Contribution of Working Group I to the Sixth Assessment Report of the Intergovernmental Panel on Climate Change [Masson-Delmotte, V., P. Zhai, A. Pirani, S. L. Connors, C. Péan, S. Berger, N. Caud, Y. Chen, L. Goldfarb, M. I. Gomis, M. Huang, K. Leitzell, E. Lonnoy, J.B.R. Matthews, T. K. Maycock, T. Waterfield, O. Yelekçi, R. Yu and B. Zhou (eds.)]. Available from https://ipcc.ch/static/ar6/wg1.9 Chau, T. T. T., Gehlen, M., and Chevallier, F., 2022: A seamless ensemble-based reconstruction of surface ocean pCO2 and air–sea CO2 fluxes over the global coastal and open oceans, Biogeosciences, 19, 1087–1109, https://doi.org/10.5194/bg-19-1087-2022 Coppola, L., J. Boutin, J.-P. Gattuso, D. Lefèvre, N. Metzl, 2021. Le système des carbonates dans la mer Ligure. In La mer Méditerranée face au changement global, Conditions de la production phytoplanctonique en mer Ligure. C. Migon, P. Nival, A. Sciandra, Eds. (ISTE Science Publishing LTD, London, UK, 2021), vol. 1, chap. 4, pp. 89-114. ISBN: 9781784057329. Crisp, D., Dolman, H., Tanhua, T., McKinley, G. A., Hauck, J., Bastos, A., et al., 2022. How well do we understand the land-ocean-atmosphere carbon cycle? Reviews of Geophysics, 60, e2021RG000736. https://doi.org/10.1029/2021RG000736 DeVries, T., 2022. Atmospheric CO2 and sea surface temperature variability cannot explain recent decadal variability of the ocean CO2 sink. Geophysical Research Letters, 49, e2021GL096018. doi: 10.1029/2021GL096018 Friedlingstein, P., et al., 2022. Global Carbon Budget 2021, Earth Syst. Sci. Data, 14, 1917–2005, https://doi.org/10.5194/essd-14-1917-2022 Iida, Y., Takatani, Y., Kojima, A. and Ishii, M., 2020. Global trends of ocean CO2 sink and ocean acidification: an observation-based reconstruction of surface ocean inorganic carbon variables. J Oceanogr. doi:10.1007/s10872-020-00571-5 Jiang, L.-Q., Carter, B. R., Feely, R. A., Lauvset, S. K. and Olsen, A., 2019. Surface ocean pH and buffer capacity: past, present and future. Sci Rep 9, 18624; doi:10.1038/s41598-019-55039-4 Laruelle, G. G., Cai W.-J., Hu X., Gruber N., Mackenzie F. T., Regnier P., 2018. Continental shelves as a variable but increasing global sink for atmospheric carbon dioxide. Nature Communications, 9, 454, doi:10.1038/s41467-017-02738-z Lauvset S., K. Currie, N. Metzl, S. Nakaoka, D. Bakker, K. Sullivan, A. Sutton, K. O’Brien and A. Olsen, 2019. SOCAT Quality Control Cookbook For SOCAT version 7. Int. Report. www.socat.info Leseurre, C., Lo Monaco, C., Reverdin, G., Metzl, N., Fin, J., Mignon, C., and Benito, L. 2022: Summer trends and drivers of sea surface fCO2 and pH changes observed in the Southern Indian Ocean over the last two decades (1998–2019), Biogeosciences, https://doi.org/10.5194/bg-19-2599-2022 Lo Monaco, C., Metzl, N., Fin, J., Mignon, C., Cuet, P., Douville, E., Gehlen, M., Trang Chau, T.T., Tribollet, A., 2021. Distribution and long-term change of the sea surface carbonate system in the Mozambique Channel (1963-2019), Deep-Sea Research Part II, https://doi.org/10.1016/j.dsr2.2021.104936 Metzl, N., Tilbrook, B., Bakker, D., Le Quéré, C., Doney, S., Feely, R., Hood, M., Dargaville, R., 2007. Global Changes in Ocean Carbon: Variability and Vulnerability. Eos, Transactions of the American Geophysical Union 88 (28): 286-287. doi: 10.1029/2007EO280005 Metzl, N., Lo Monaco, C., Leseurre, C., Ridame, C., Fin, J., Mignon, C., Gehlen, M., and Chau, T. T. T., 2022: The impact of the South-East Madagascar Bloom on the oceanic CO2 sink, Biogeosciences, 19, 1451–1468, https://doi.org/10.5194/bg-19-1451-2022 Pfeil, B., Olsen, A., Bakker, D. C. E., et al., 2013. A uniform, quality controlled Surface Ocean CO2 Atlas (SOCAT), Earth Syst. Sci. Data, 5, 125-143, doi:10.5194/essd-5-125-2013 Rödenbeck, C., Bakker, D. C. E., Gruber, N., Iida, Y., Jacobson, A.R., et al., 2015. Data-based estimates of the ocean carbon sink variability – First results of the Surface Ocean pCO2 Mapping intercomparison (SOCOM). Biogeosciences 12: 7251-7278. doi:10.5194/bg-12-7251-2015. Sutton, A. J., Williams, N. L., & Tilbrook, B. ,2021. Constraining Southern Ocean CO2 Flux Uncertainty Using Uncrewed Surface Vehicle Observations. Geophysical Research Letters, 48, e2020GL091748. Doi:10.1029/2020GL091748 Tanhua, T., Lauvset, S.K., Lange, N. et al. , 2021. A vision for FAIR ocean data products. Commun Earth Environ 2, 136, https://doi.org/10.1038/s43247-021-00209-4 Wanninkhof, R., P. Pickers, A. Omar, A. J. Sutton, A. Murata, et al., 2019. A surface ocean CO2 reference network, SOCONET and associated marine boundary layer CO2 measurements. Frontiers in Marine Science, 6, 400, DOI:10.3389/fmars.2019.00400 Watson, A. J., Schuster, U., Shutler, J.D. et al., 2020. Revised estimates of ocean-atmosphere CO2 flux are consistent with ocean carbon inventory. Nat Commun 11, 4422. https://doi.org/10.1038/s41467-020-18203-3 WMO/GCOS, 2018: https://gcos.wmo.int/en/global-climate-indicators |