The updated SNAPO-CO2 database: 30 years of observations of alkalinity and dissolved inorganic carbon in the ocean
The SNAPO-CO2 database of ocean alkalinity and dissolved inorganic carbon data from French oceanographic campaigns conducted between 1993 and 2023 has been updated and published this month in the journal ESSD. This database brings together nearly 67,000 observations in the world ocean, the Mediterranean and coastal areas. It is based on analyses by the SNAPO-CO2 Service of CNRS Terre & Univers, housed at the Laboratory of Oceanography and Climate: Experimentation and Numerical Approaches (LOCEAN-IPSL/OSU Ecce Terra, SU/CNRS/MNHN/IRD). The database is accompanied by data from INSU’s OISO Observations Service.
The ocean, with its capacity to absorb around 25% of anthropogenic CO2 emissions and over 90% of excess heat each year, plays a crucial role in regulating climate change. Reducing the uncertainties in estimates of CO2 fluxes and future climate predictions is a challenge if we are to better guide action and adaptation policies. To refine the numerical representation of the carbon cycle in coupled climate/carbon models (such as CMIP), we need to understand the dynamic, physico-chemical and biological processes that govern it. This is all the more important given that a direct consequence of CO2 emissions due to human activities and its absorption by the oceans is the phenomenon of acidification (reduction in pH), the impact of which on marine ecosystems such as coral remains to be assessed. In this context, it is advisable to have precise observations of oceanic CO2 and, if possible, in all oceanic sectors and at different seasons and periods, as the oceanic carbon cycle is highly variable in time and space, and depending on whether we are in offshore or coastal areas.
To complement the international SOCAT (www.socat.info, dedicated to surface CO2 fugacity data) and GLODAP (www.glodap.info, dedicated to geochemical data in the water column) databases, the SNAPO-CO2 database synthesises ocean alkalinity (AT) and dissolved inorganic carbon (TC) data. This database now includes almost 67,000 observations from campaigns and time series conducted by French teams between 1993 and 2023 in various ocean regions, coastal areas and the Mediterranean. The seawater samples collected during the campaigns were analysed at the national SNAPO-CO2 analysis service (INSU/OSU Ecce Terra). This unique database provides crucial information for studying the distributions of AT and CT concentrations in the global ocean (Figure 1), their temporal evolution in various regions (Figure 2), validating oceanic (Figure 3) and coupled climate/carbon (CMIP) models as well as data from the BGC-ARGO autonomous float pH sensors. AT and CT data can also be used to calculate pH and estimate ocean acidification (Figure 4).
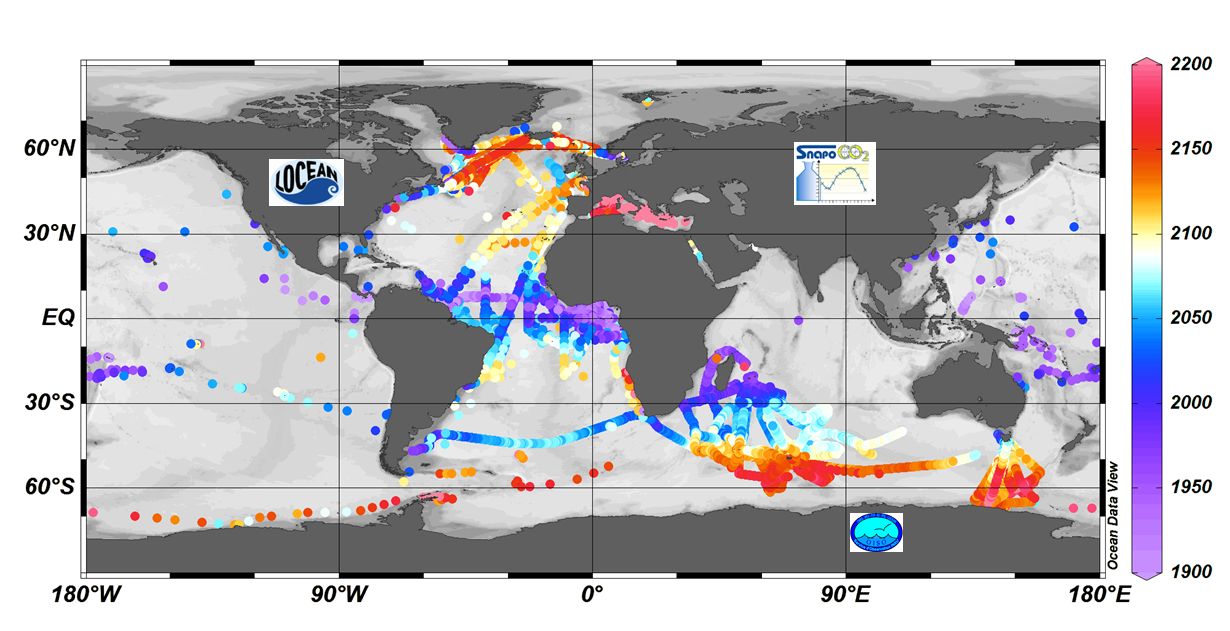
Figure 1. Distribution of dissolved inorganic carbon concentrations (in µmol.kg-1) in surface waters of the global ocean compiled from the SNAPO-CO2-v2 database (adapted from Metzl et al., 2025).
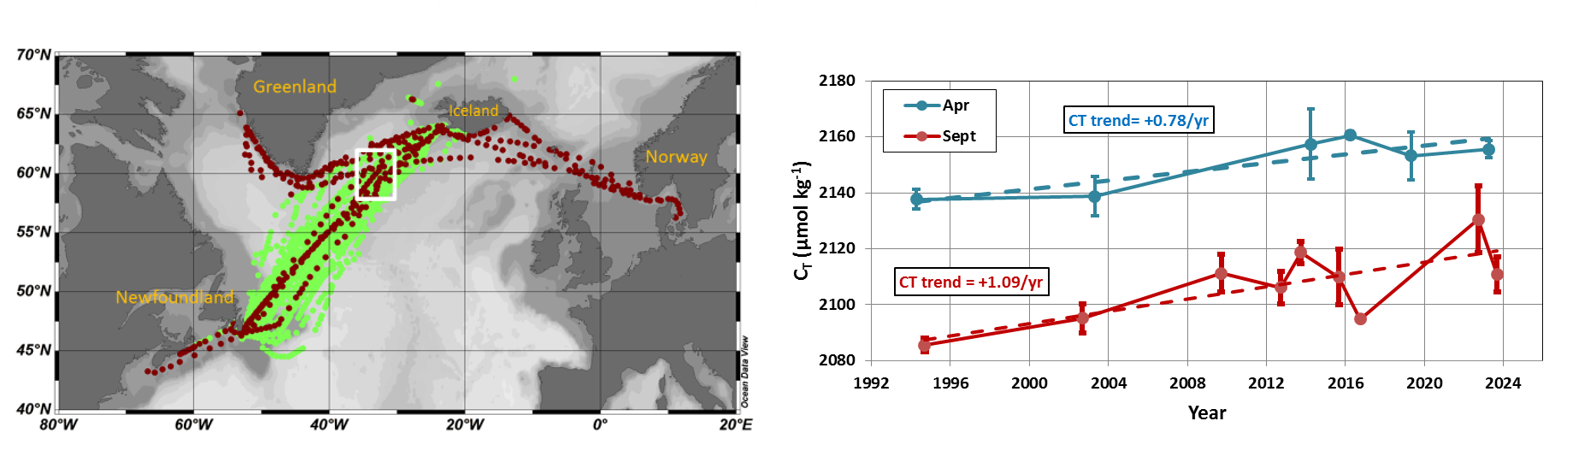
Figure 2: Example of the temporal evolution of dissolved inorganic carbon concentrations (TC in µmol.kg-1) in the North Atlantic. The increase in TC in the subpolar zone around 60°N (white square on the map on the left) here for the months of April or September partly reflects the accumulation of anthropogenic CO2. The data come from the SURATLANT campaigns conducted between 1993 and 2023, the locations of which for the SNAPO-CO2-V1 database are shown in green and for the SNAPO-CO2-V2 version in brown (adapted from Metzl et al., 2025).
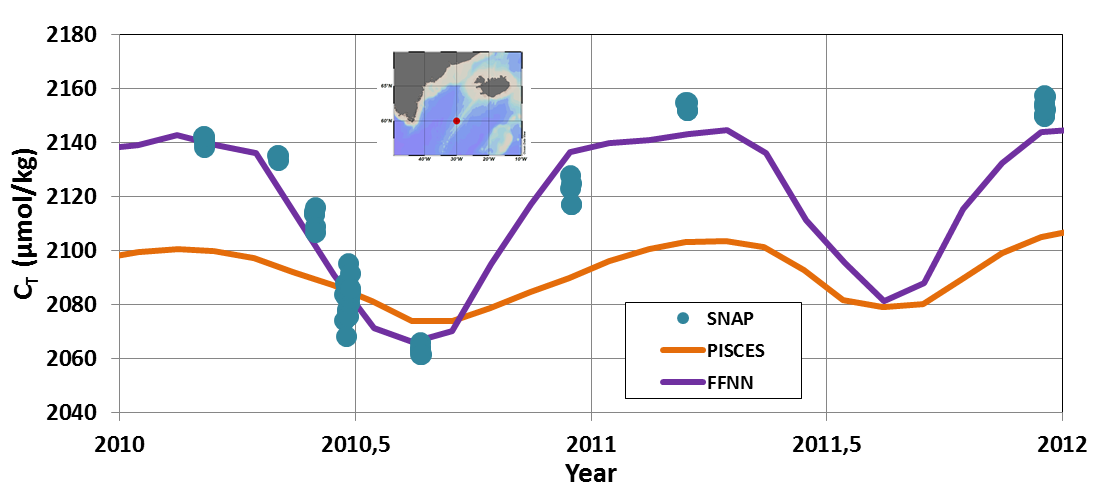
Figure 3. Example of a comparison of the seasonal cycle of dissolved inorganic carbon concentrations (TC in µmol.kg-1) in the North Atlantic at 60°N. Observations from the SURATLANT and OVIDE campaigns (blue circles) and the FFNN neural model (Chau et al., ESSD, 2024, purple line) show a marked seasonal cycle compared with the PISCES ocean model (orange line).
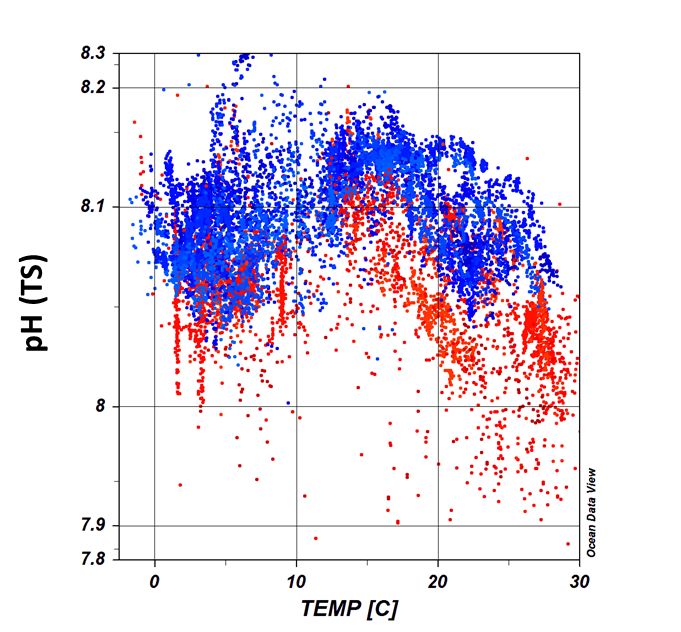
Figure 4. Ocean acidification is detected using the SNAPO-CO2-v2 database: here the pH is calculated using AT and CT data and presented as a function of temperature (°C) for the periods 1998-2002 (blue) and 2020-2023 (red). The pH is lower in recent years, reflecting ocean acidification (adapted from Metzl et al., 2025).
More
The SNAPO-CO2 database is freely accessible on the SeaNoe website (https://doi.org/10.17882/102337). It is also online at Ocean Data View (https://odv.awi.de/data/ocean/snapo-co2/) and completes the international GOA-ON database (Global Ocean Acidification Observing Network, www.goa-on.org/) dedicated to the study of ocean acidification.
Reference
Metzl, N., Fin, J., Lo Monaco, C., Mignon, C., Alliouane, S., Bombled, B., Boutin, J., Bozec, Y., Comeau, S., Conan, P., Coppola, L., Cuet, P., Ferreira, E., Gattuso, J.-P., Gazeau, F., Goyet, C., Grossteffan, E., Lansard, B., Lefèvre, D., Lefèvre, N., Leseurre, C., Petton, S., Pujo-Pay, M., Rabouille, C., Reverdin, G., Ridame, C., Rimmelin-Maury, P., Ternon, J.-F., Touratier, F., Tribollet, A., Wagener, T., and Wimart-Rousseau, C.: An updated synthesis of ocean total alkalinity and dissolved inorganic carbon measurements from 1993 to 2023: the SNAPO-CO2-v2 dataset, Earth Syst. Sci. Data, 17, 1075–1100, https://doi.org/10.5194/essd-17-1075-2025, 2025.
Contact