The 2026 version of the international SOCAT ocean CO2 database
The latest version of the international SOCAT database (Surface Ocean CO2 Atlas, https://socat.info) was released on June 16, 2026. This database, which brings together more than 50 million observations of carbon dioxide in the surface waters of the world’s oceans, is the result of an international collaboration launched in 2007, in which the Laboratory of Oceanography and Climate: Experimentation and Numerical Approaches (LOCEAN/IPSL/OSU Ecce Terra, SU/CNRS/MNHN/IRD).
Every year, human activities release increasing amounts of CO2 into the atmosphere. Every year, unsurprisingly, we see a rise in atmospheric CO2 levels. By 2025, the average atmospheric CO2 level had exceeded 425 ppm (Lan et al, 2026). This is 141 ppm higher than pre-industrial levels (284 ppm in 1825). Thus, over 200 years, we have seen a rise in CO2 that already accounts for half of pre-industrial concentrations. However, of the 755 PgC released over the past two centuries, the ocean has captured 205 PgC, limiting the impact of anthropogenic CO2 emissions on climate change. Furthermore, without the oceanic CO2 sink, the level of CO2 in the atmosphere would be 527 ppm, a level expected in just 20 years’ time if policies are not implemented to limit emissions.
To quantify the ocean carbon sink, it is necessary to have accurate observations of ocean CO2—ideally across all ocean regions and at different times of year—as the ocean carbon cycle varies significantly over time and space, and differs between offshore and coastal areas. This is the objective of the SOCAT ocean CO2 database, initiated at a workshop in Paris (Metzl et al., 2007) and regularly updated since 2011 (Bakker et al., 2016, https://socat.info).
The 2026 version has been expanded with new, validated data from 432 oceanographic surveys, opportunity vessels, moored sensors and drifting platforms (Figure 1).
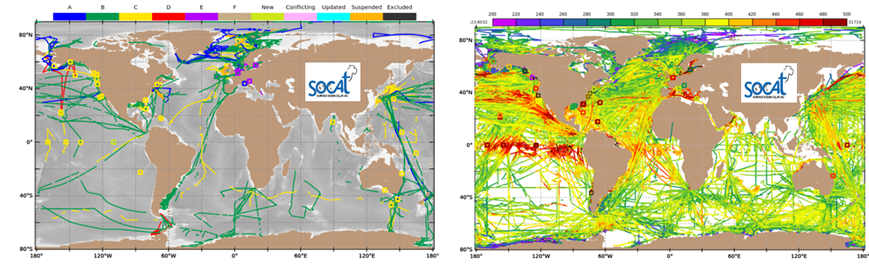
Figure 1. Left. Distribution of new observations incorporated into the SOCAT-v2026 database (the colour coding represents the Quality Flag associated with each time series). Right. The complete set of CO2 fugacity (fCO2₂, µatm) data at the ocean surface in the SOCAT database for the period 1957–2025. The squares represent CO2 sensors at moorings. With atmospheric CO2 levels currently approaching 420 ppm, the blue-green (and red) areas indicate that the ocean is acting as a CO2 sink (or source). These data can be used to constrain extrapolation models for assessing large-scale air-sea CO2 exchanges (Figure 2) or pH distribution to study ocean acidification (Figure 3). D. R.
Since the first version in 2011, which contained 6.3 million data points (Pfeil et al., 2013), SOCAT now contains over 50 million observations of CO2 fugacity in the surface waters of the global ocean and coastal areas, covering the period 1957–2025. This database is important because it provides information, amongst other things, on the oceanic CO2 sink and its evolution on a global scale (Friedlingstein et al., 2026) . For the past three decades, despite the uncertainties in numerical methods, the increase in the ocean carbon sink has been a robust signal and, since 2015, it has been observed that the ocean has captured more carbon than the continents (Figure 2).
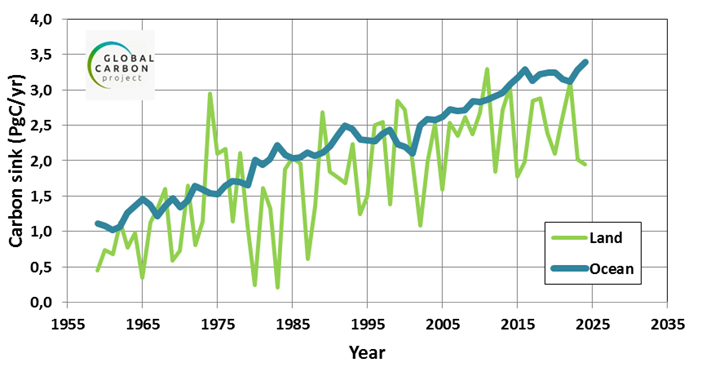
Figure 2. Continental (green) and oceanic (blue) carbon sinks estimated for the period 1959–2025 (in PgC/year). Figure based on data from the Global Carbon Project (Friedlingstein et al., 2026). One thing is certain: the oceanic carbon sink is increasing over time. Since 2015, it has on average been more significant than the continental sink, and significantly stronger in 2024 – a trend that will need to be confirmed next year.
The 2026 version of SOCAT will confirm whether the 2024 ocean CO2 sink of 3.4 PgC/year remains larger than the terrestrial sink of 1.9 PgC/year. Together, these two compartments will account for 45% of emissions in 2024. The SOCAT database, which forms part of the ‘Global Ocean Observing System’ (GOOS, 2026 https://goosocean.org/) It thus provides valuable insights into reducing uncertainties regarding the global carbon balance and sheds light on the consequences of rising anthropogenic CO2 levels in the ocean (ocean acidification, Figure 3).
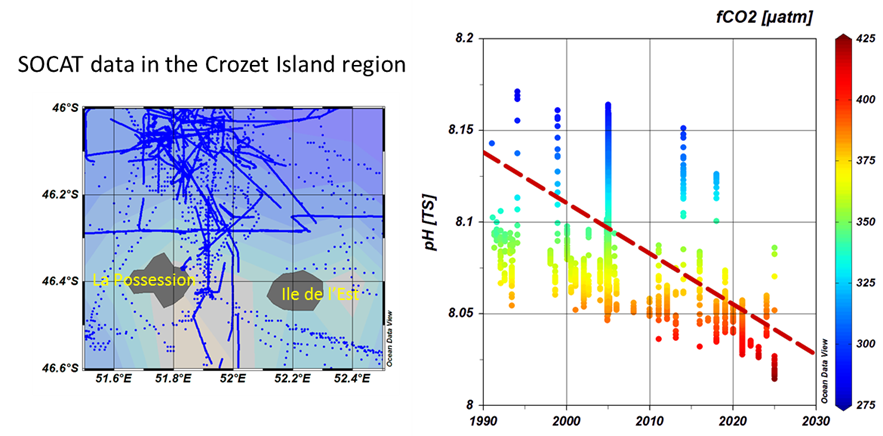
Figure 3. Example of pH trends in the surface ocean over time. Results derived from selected SOCAT data in the Southern Indian Ocean around the Crozet Islands (data from historical surveys and OISO since 1998). The colour coding represents oceanic fCO2. The decrease in pH, of the order of -0.028 per decade over the period 1991–2025 during the southern summer (red line), reflects ocean acidification due to the increase in anthropogenic CO2. The lowest pH of 8.01 was recorded during the OISO-35 campaign in January 2025.
In addition to the data available online, accompanied by assessment comments (Quality Flag, Gkritzalis et al., 2024), the database also offers gridded products at various resolutions for the open ocean and the coastal zone, which can be used to construct climatologies, initialise and validate ocean biogeochemical models and climate-carbon coupled models (CMIP), or constrain atmospheric inversion models. An interactive visualisation tool (LAS Data Viewer) provides easy access to the data, which can be extracted by region, period, ship or platform (buoys or moorings). Matlab code for reading the data files and gridded products, as well as the ODV (Ocean Data View) format, https://odv.awi.de/) are also available online. They have recently been incorporated into the Fr-OOS ocean database (https://froos.fr). The SOCAT database, along with other databases such as GLODAP (https://glodap.info) or SNAPO-CO2 is included in a recent review of databases dedicated to oceanic CO2 synthèse des bases de données dédiées au CO2 océanique (Jiang et al., 2026).
It should be noted that the work of making data available and ensuring its quality control is mainly carried out by volunteer researchers, and ensuring the continuity of these efforts in the future will require sustainable resources. The continuity of these observations and their synthesis is strongly recommended (IOC/UNESCO, 2026), but this depends heavily on commitments, not only at the level of national policies (maintaining observation networks) but also ensuring international coordination with GOOS and the IPCC. To limit and adapt to climate change, ‘every half-degree counts’. To reduce uncertainties regarding the oceanic CO2 sink, “every campaign counts”.
The IPSL’s LOCEAN laboratory regularly contributes to this database (OISO/COOL observatories, SSS-CO2 measurements, SOSO campaigns on the Astrolabe), contributes to data quality control, and participates in the coordination of SOCAT groups. The SOCAT project is coordinated by Dorothee Bakker (University of East Anglia, UK). It has been supported by international programmes (SOLAS, IOCCP) and numerous national institutes.
Contact
References
– Bakker, D. C. E., Pfeil, B., Landa, C. S., Metzl, N., O’Brien, K. M., et al., 2016.: A multi-decade record of high-quality fCO2 data in version 3 of the Surface Ocean CO2 Atlas (SOCAT), Earth Syst. Sci. Data, 8, 383-413 – doi:10.5194/essd-8-383-2016
– Friedlingstein, P., et al. Global Carbon Budget 2025, Earth Syst. Sci. Data, 18, 3211–3288, https://doi.org/10.5194/essd-18-3211-2026, 2026.
– Gkritzalis, T., et al., 2024. SOCAT Quality Control Cookbook – For version 2025 of the Surface Ocean CO2 Atlas. Available at www.socat.info
– Global Ocean Observing System 2030 Strategy Report No. IOC/BRO/2019/5 rev.2, GOOS Report No. 239 (Intergovernmental Oceanographic Commission of UNESCO, 2019).
– IOC of UNESCO. 2026. Integrated Ocean Carbon Research: a vision primed for implementation. Paris, UNESCO. (IOC Technical Series, 214.) https://doi.org/10.71245/FULK2623
– Jiang, L.-Q., et al. Synthesis of data products for ocean carbonate chemistry, Earth Syst. Sci. Data, 18, 1405–1462, https://doi.org/10.5194/essd-18-1405-2026, 2026
– Lan, X., Tans, P. and K.W. Thoning: Trends in globally-averaged CO2 determined from NOAA Global Monitoring Laboratory measurements. Version 2026-05
https://doi.org/10.15138/9N0H-ZH07
– Metzl, N., Tilbrook, B., Bakker, D. C. E., Le Quéré, C., Doney, S., Feely, R., Hood, M., Dargaville, R., 2007. Global Changes in Ocean Carbon: Variability and Vulnerability. Eos, Transactions of the American Geophysical Union 88 (28): 286-287.
doi:10.1029/2007EO280005
– Pfeil, B., Olsen, A., Bakker, D. C. E., et al. 2013. A uniform, quality controlled Surface Ocean CO2 Atlas (SOCAT), Earth Syst. Sci. Data, 5, 125-143, doi:10.5194/essd-5-125-2013